
precise meaning to tell a story' ~ George-Palilonis,


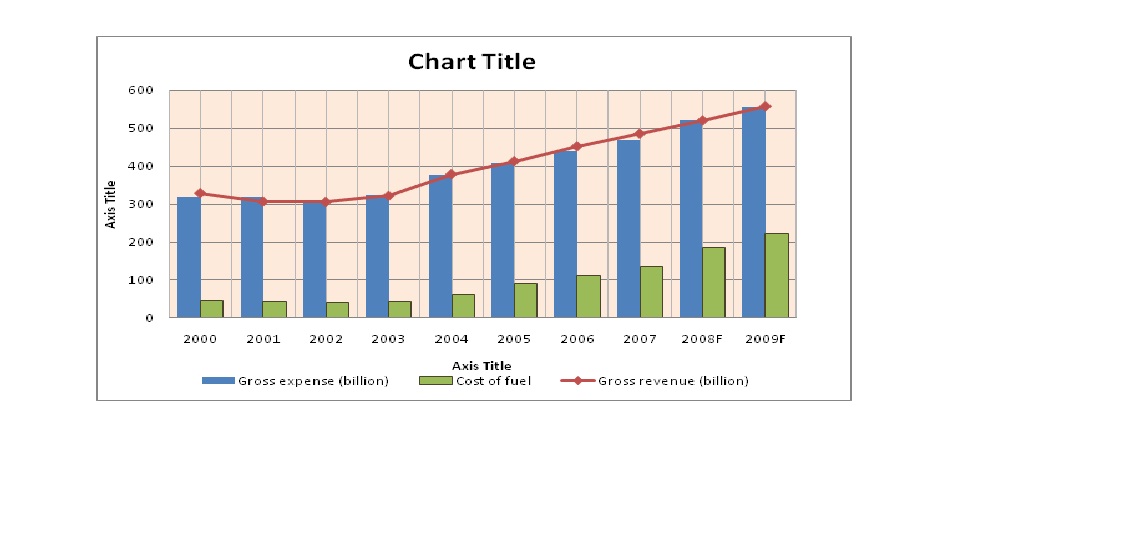
The consideration which I made in designing the information graphic is firstly to follow the rules and guides of making graph. The rules that govern all graphs like standardize the methodology for replication and giving clear information. In order to let the users, in this case the shareholders, to attract their attention to view the report using information graphics, showing this graphs to them is not just for imaginative direction and fun, I consider it as a creative and fantastic mode to take complex or reports and deliver them in simpler ways that remain appealing and interesting to the shareholders.
Using these charts, I believe the shareholders will not lost interest in the information that I am showing since information graphics is tended to assist with that a great deal. In this situation this will help the shareholders connect with the information in a way they would not have necessarily been able to previously.
Reference:
Petterson, R. (1993). Visual Information (2nd ed.) (pp. 169-175). New Jersey: Educational technology Publications.
Lester, P. M. (1995). Informational graphics. Visual communication: Images with messages (pp. 187-‐211).
California: Wadsworth Publishing.
No comments:
Post a Comment